EN
RU
中文

 Data acquisition and monitoring
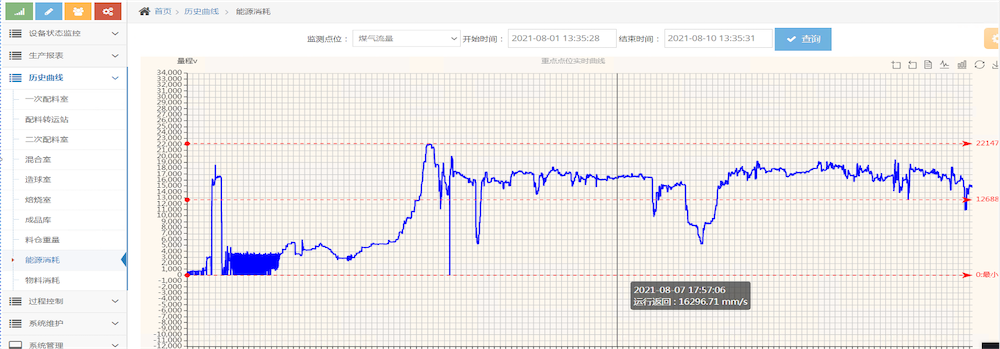
Energy consumption of pellet production covers gas, electricity, compressed air, process water and other media. By collecting process operating parameters and tracking real-time consumption fluctuation, the system calculates consumption variation within different periods, and generates early warnings based on consumption, output, specific consumption and other indicators.
 Production energy consumption analysis
The system counts cases of excessive energy consumption, processes massive data combined with relevant influencing factors to realize refined management, and supports decision-making based on data analysis results.
 Energy data management and reporting
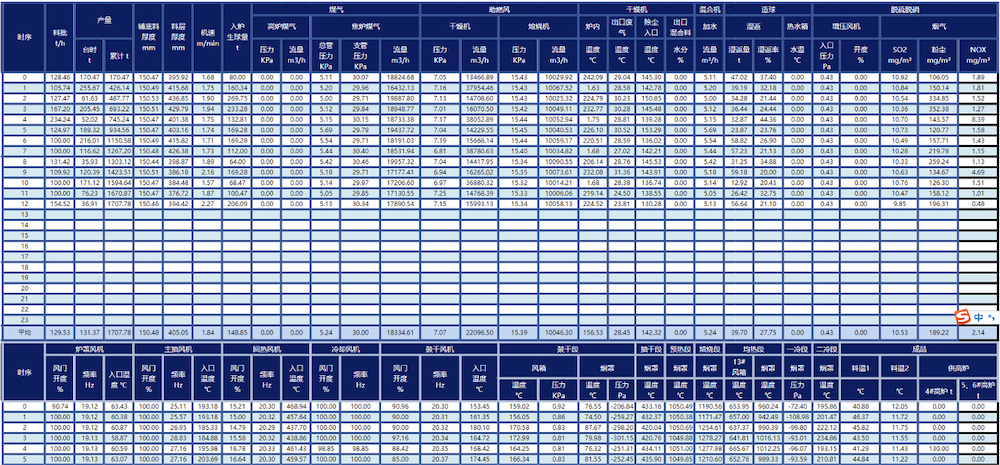
Relying on the report engine of Industrial Internet Platform, WYSIWYG report development is realized via drag-and-drop configuration. The system supports diversified graphic components, multi-dimensional combination, hierarchical data drilling and multi-variate data analysis, providing customizable and upgradable energy & environment reports.
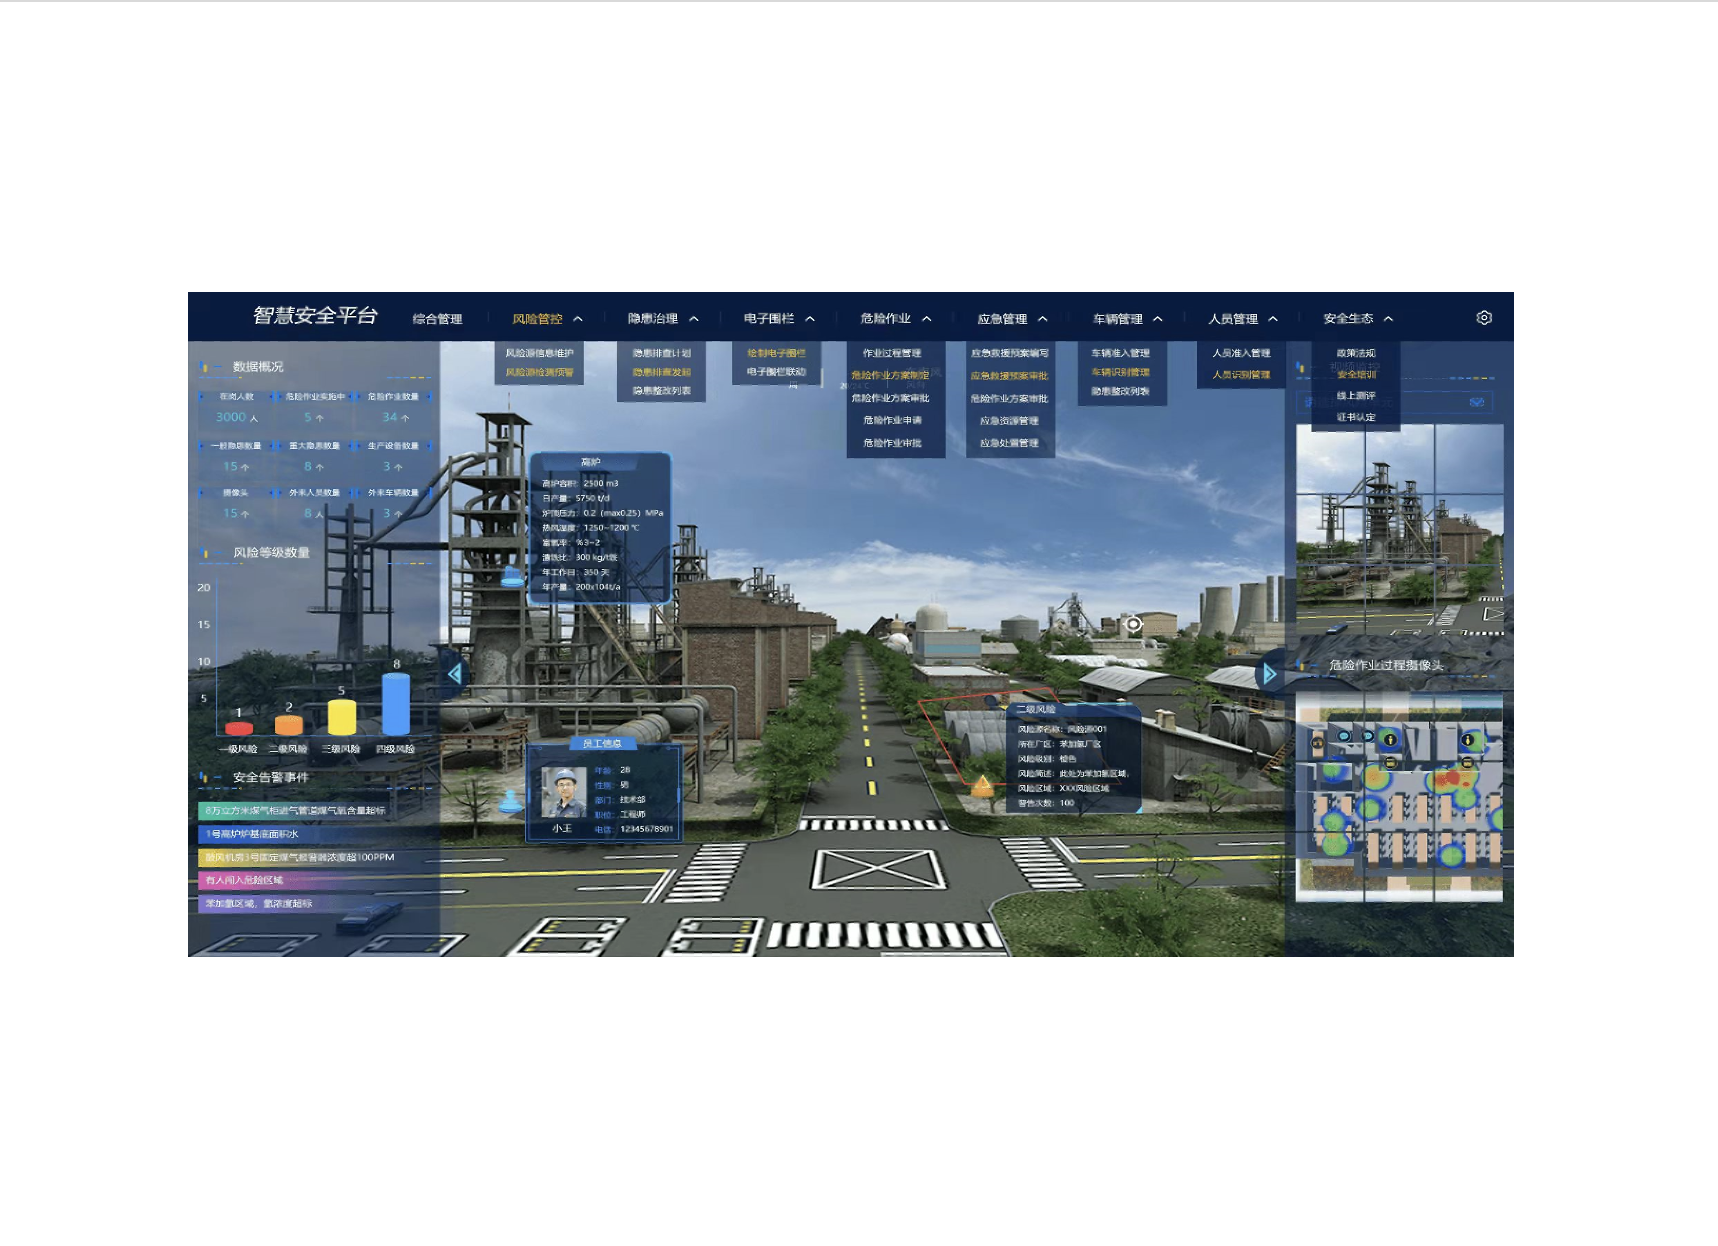
Smart Safety Management Platform
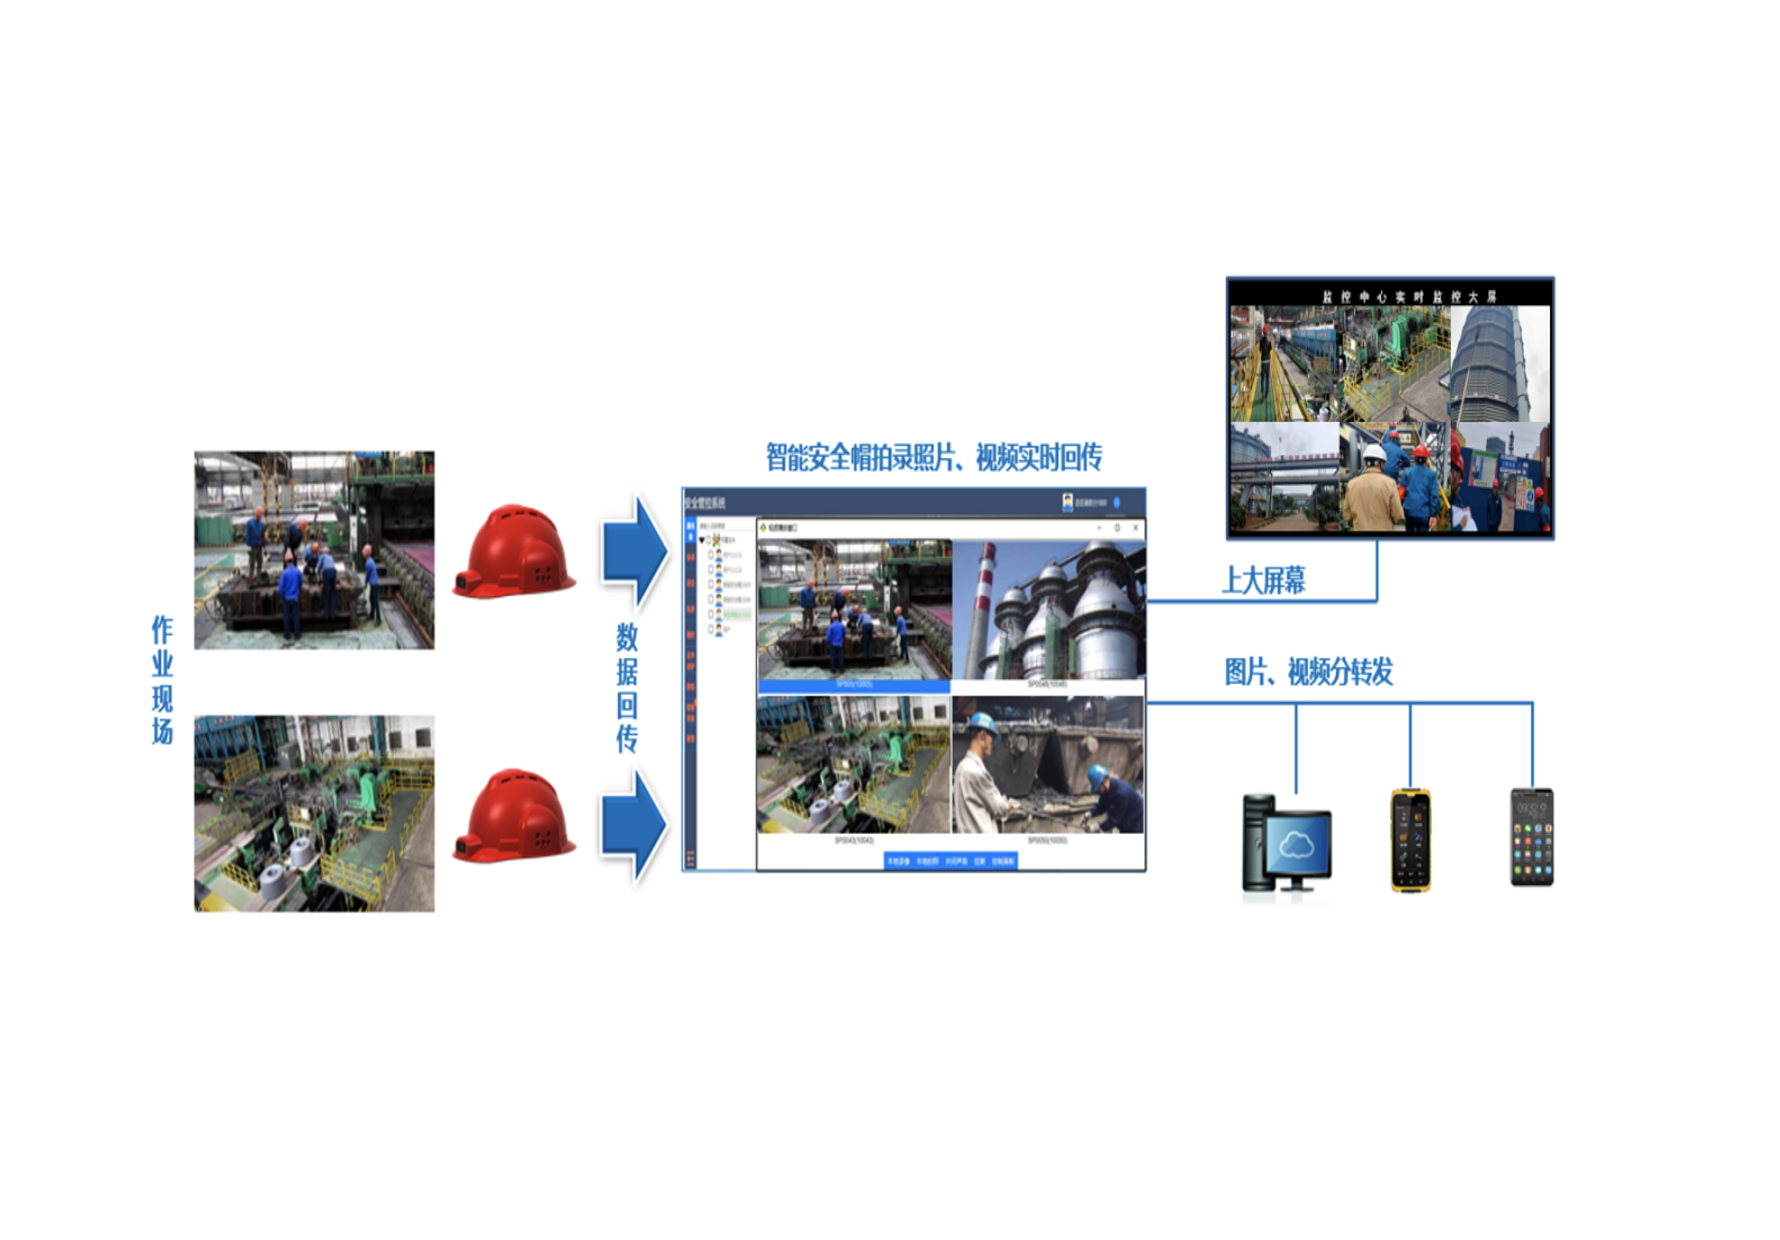
Operation Safety Management
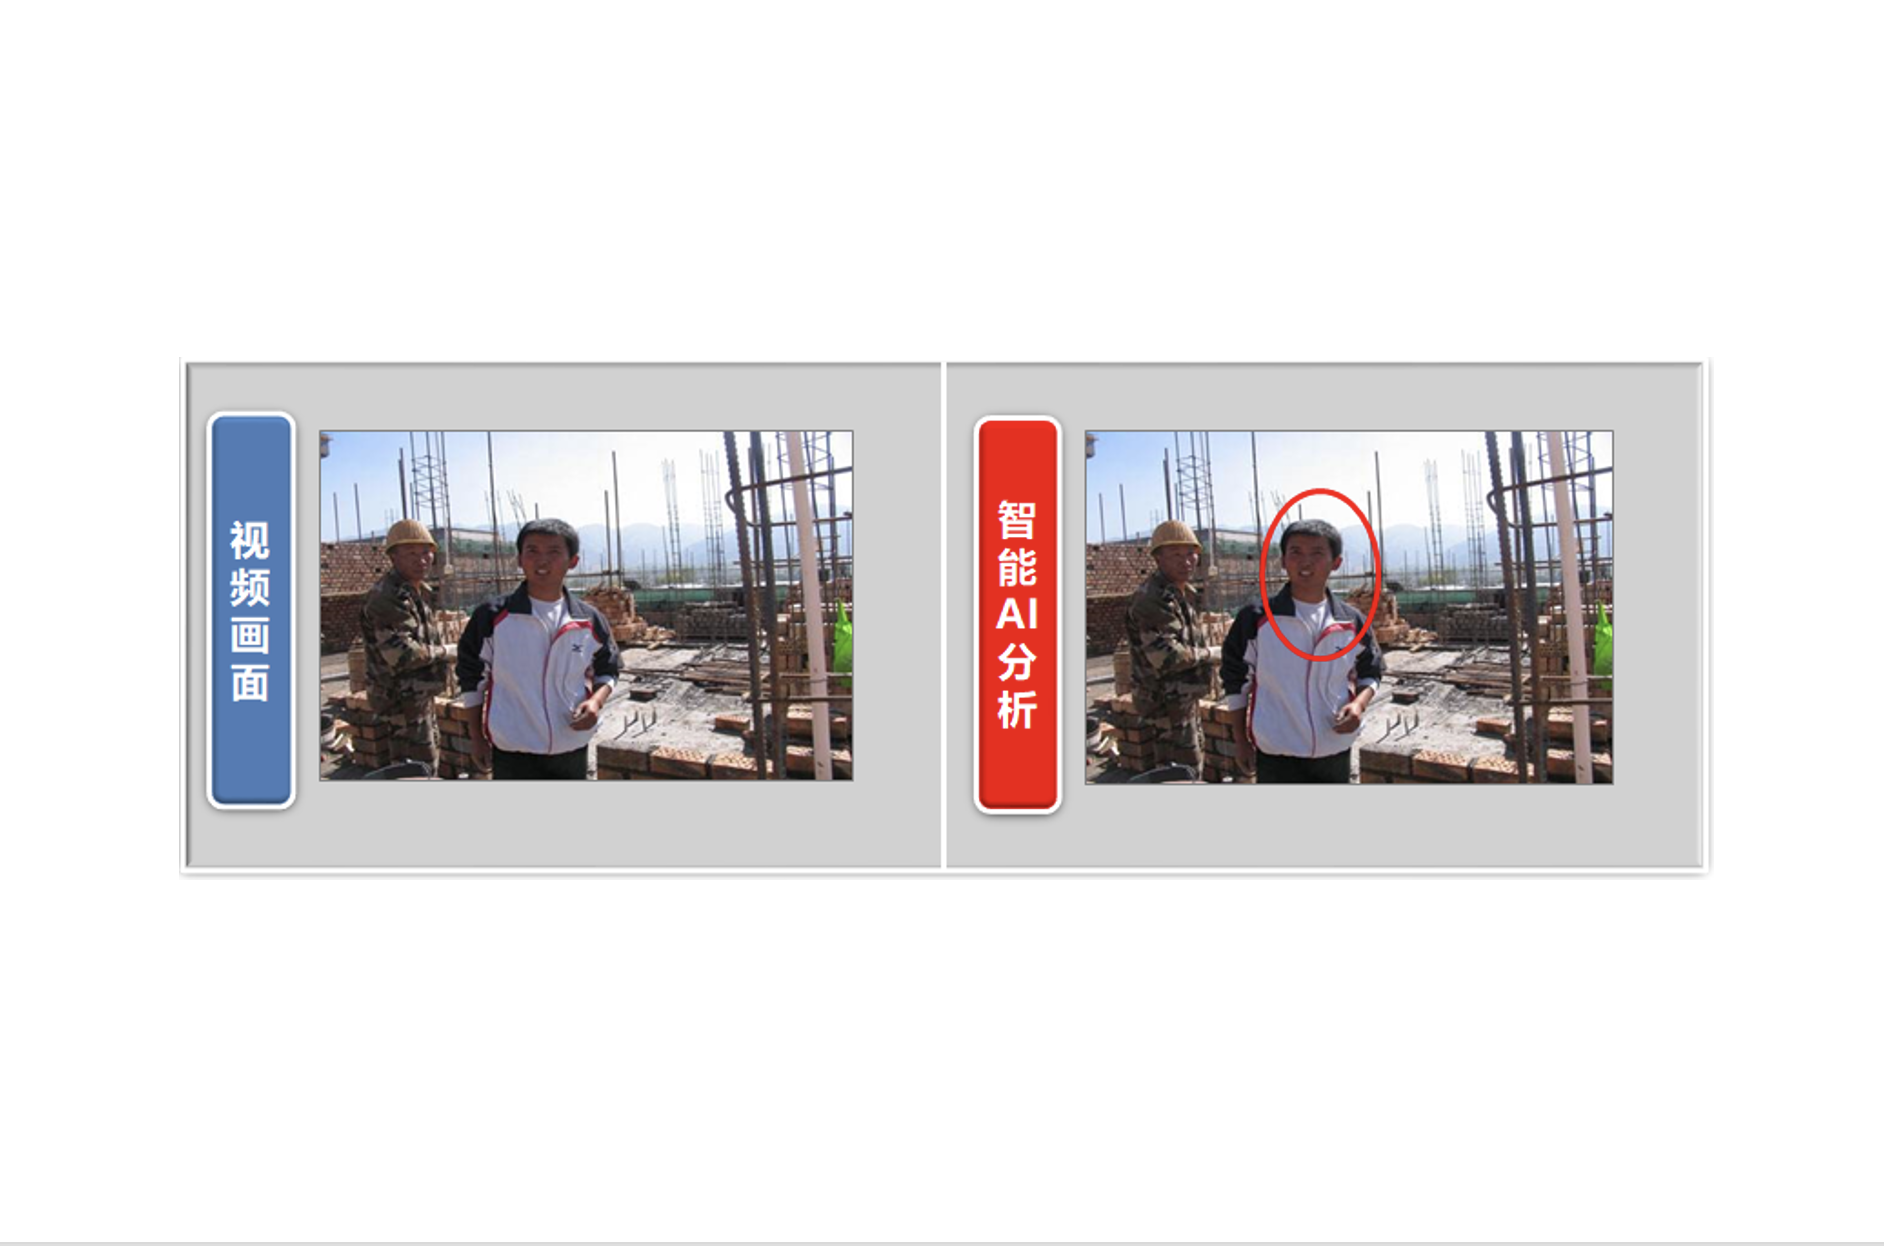
Personnel Safety Management
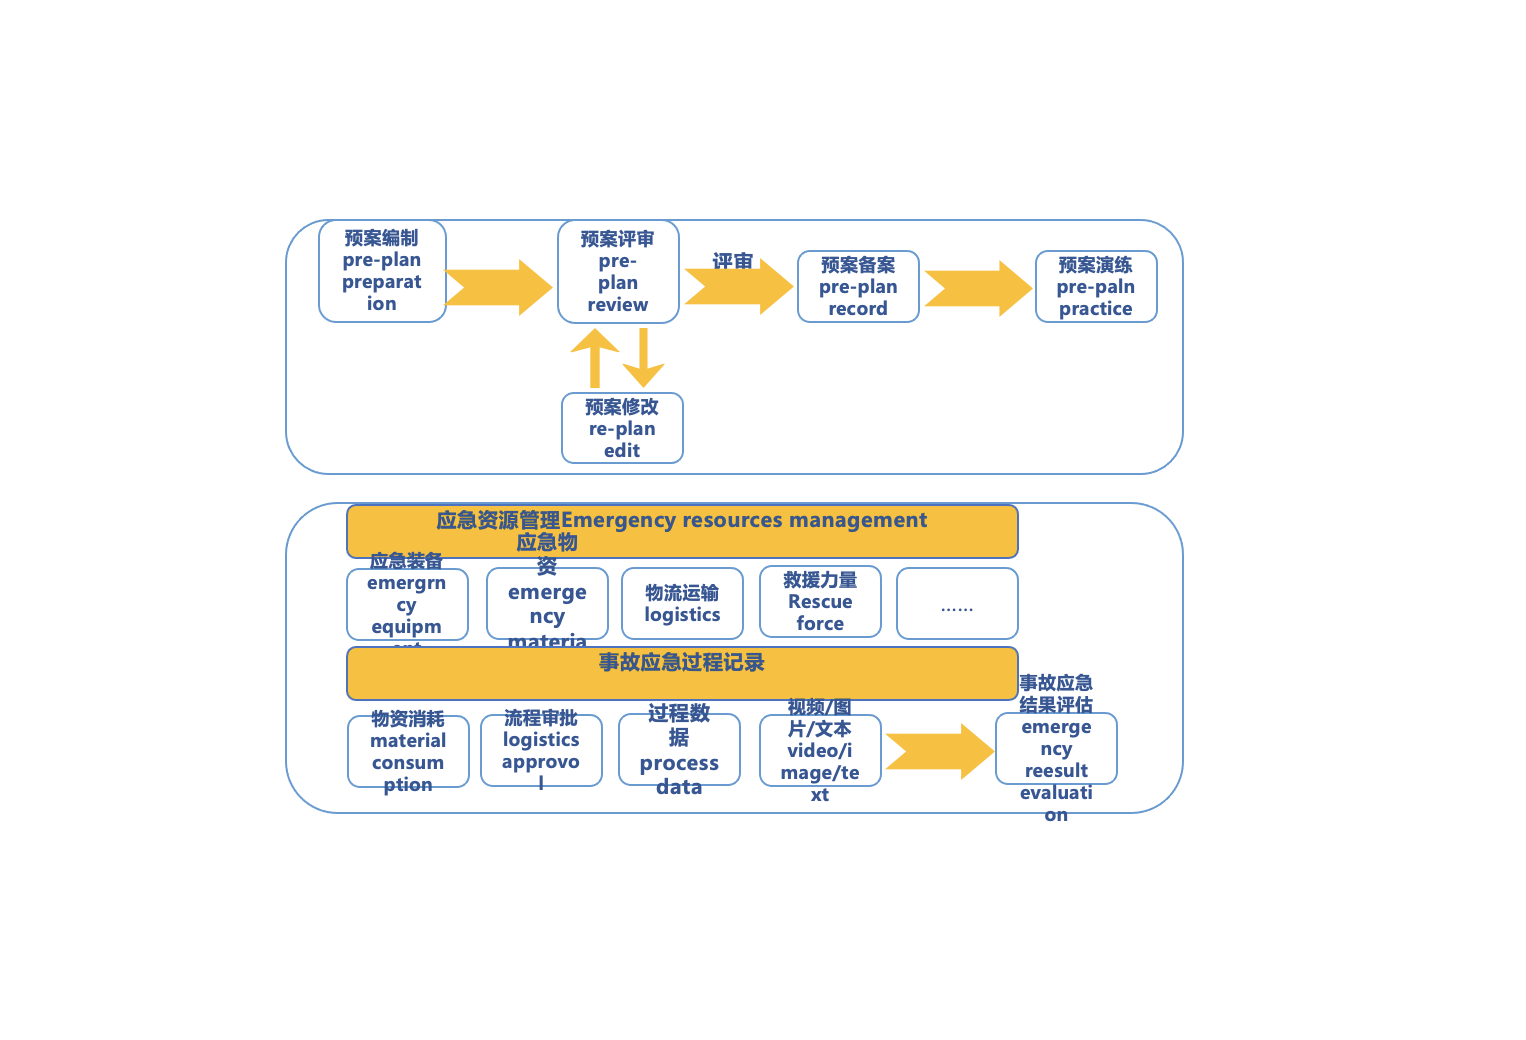
Intelligent Emergency Management for Accidents
A smart safety system is deployed to protect personnel from injuries and ensure safe, stable and efficient production. It detects personnel behaviors, monitors hazardous zones and controls operation safety to minimize accidents and guarantee safe production.
Smart Safety Management Platform
Personnel Safety Management
Operation Safety Management
Intelligent Emergency Management for Accidents
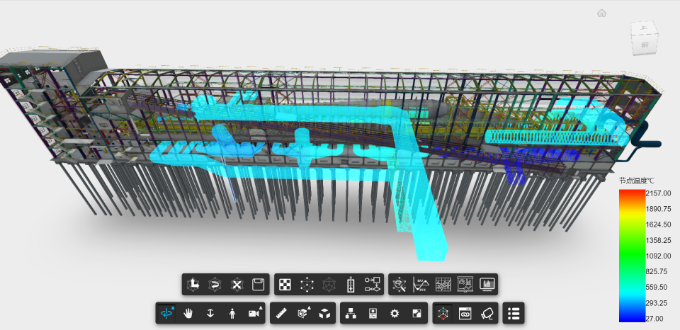
 Technical Advantage
Built on self-developed lightweight 3D rendering library, ultra-lightweight 3D models from over 50 formats of design files can be rendered and previewed directly in browsers without extra software installation.
Metadata embedding, exchange and retrieval are supported on mainstream browsers including Chrome, IE, Firefox. 2D & 3D model data can be imported from AutoCAD, Fusion360, Revit and wide-ranging applications.
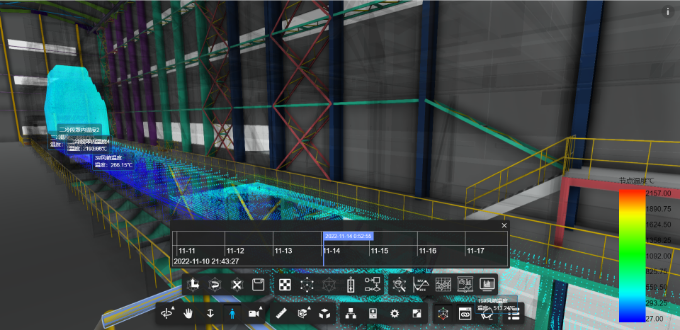
 Program Benefits
Controllable investment cost of hardware and software construction;
Low maintenance and system reset cost for operators, low dependence on hardware & software suppliers;
User-friendly operation, easy system maintenance and controllable training cost.
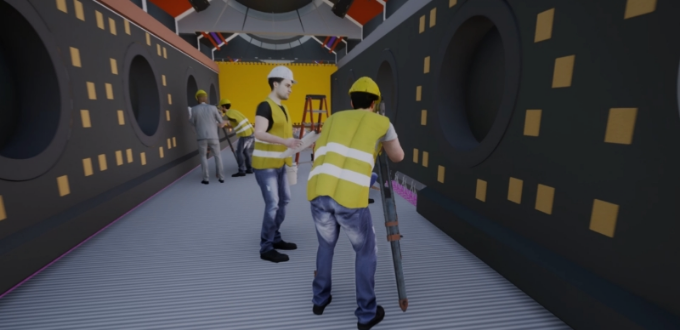
 Technical Advantage
Adopting world-leading mixed reality technology, compatible with mainstream domestic & international head-mounted devices and large-space real-time positioning technology.
Training scenes are reproduced 1:1 in virtual environment supporting multi-post collaborative operation.
Multi-scenario courses covering skill training, assessment, early warning drill and accident handling satisfy the demands of production operation, maintenance and management.
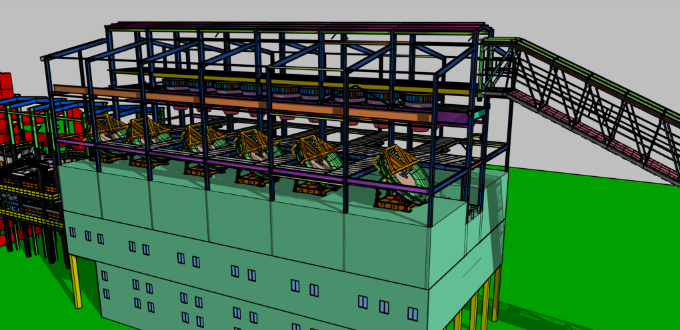
 Program Benefits
Over 80% reduction of training cost and 90% reduction of deployment time;
Training contents expanded by 2~3 times;
Flexible scene configuration & switching, practice highly close to real working conditions;
Standardized assessment system;
Full-process data tracking.
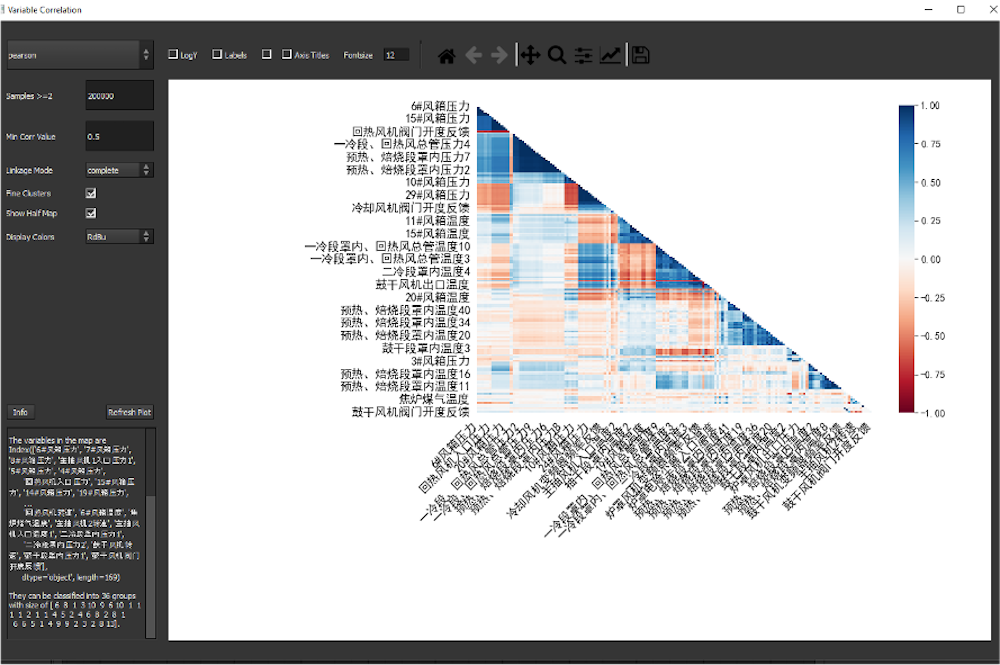
In the diagram, blue indicates positive correlation, red indicates negative correlation; darker color stands for stronger correlation.
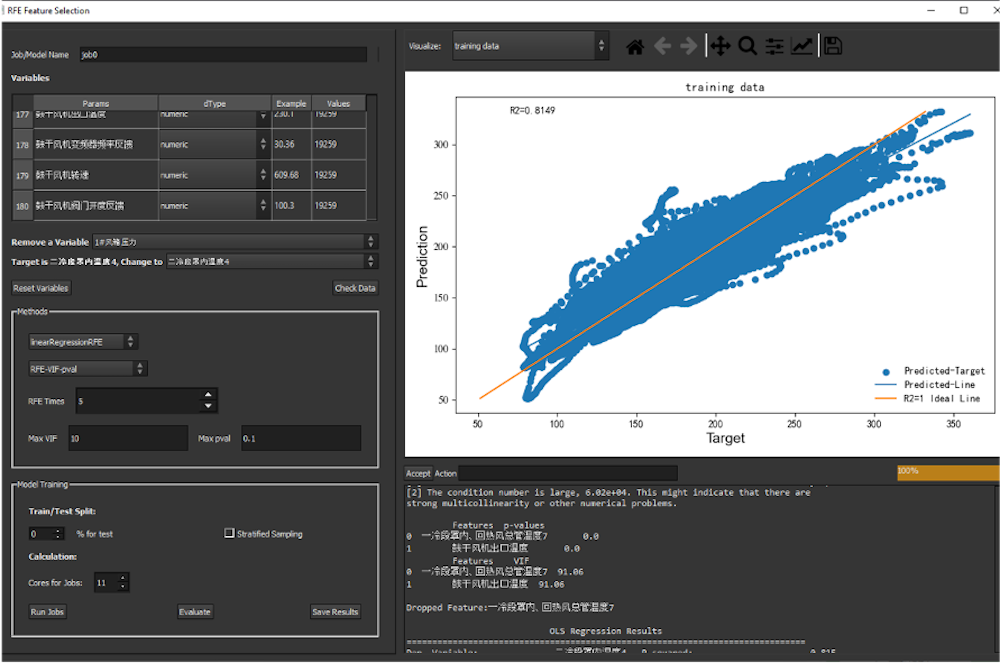
It analyzes the correlation between multiple groups of characteristic parameters to identify and train the sensitivity of data sets under different working conditions.
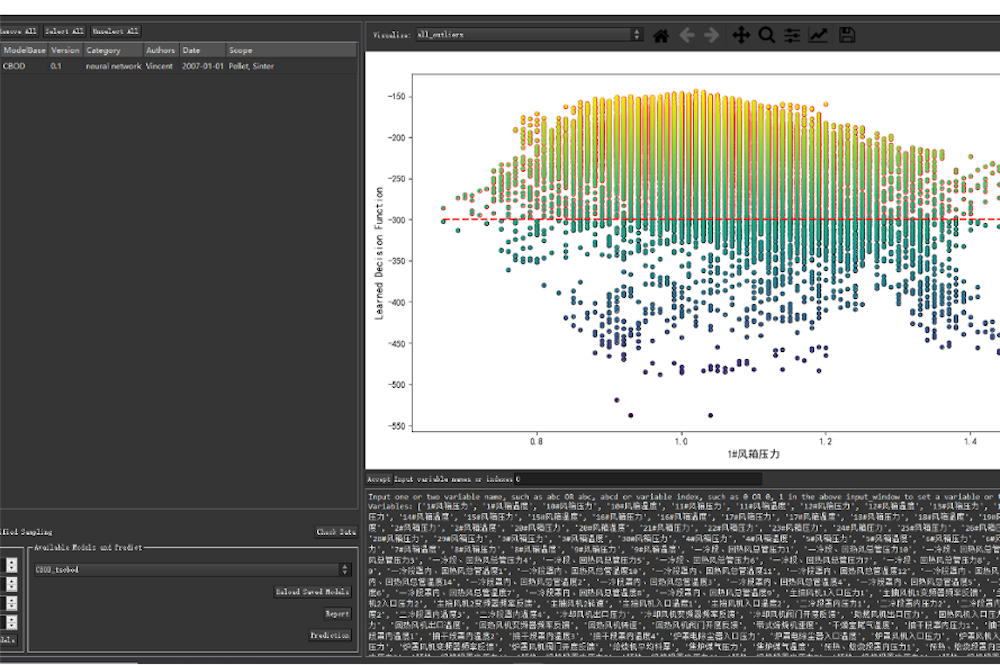
The red line is the anomaly threshold. Red dots above the line represent normal data, while dots below represent abnormal data. Combined with normal distribution analysis, the system identifies root causes of anomalies and optimizes process specifications.
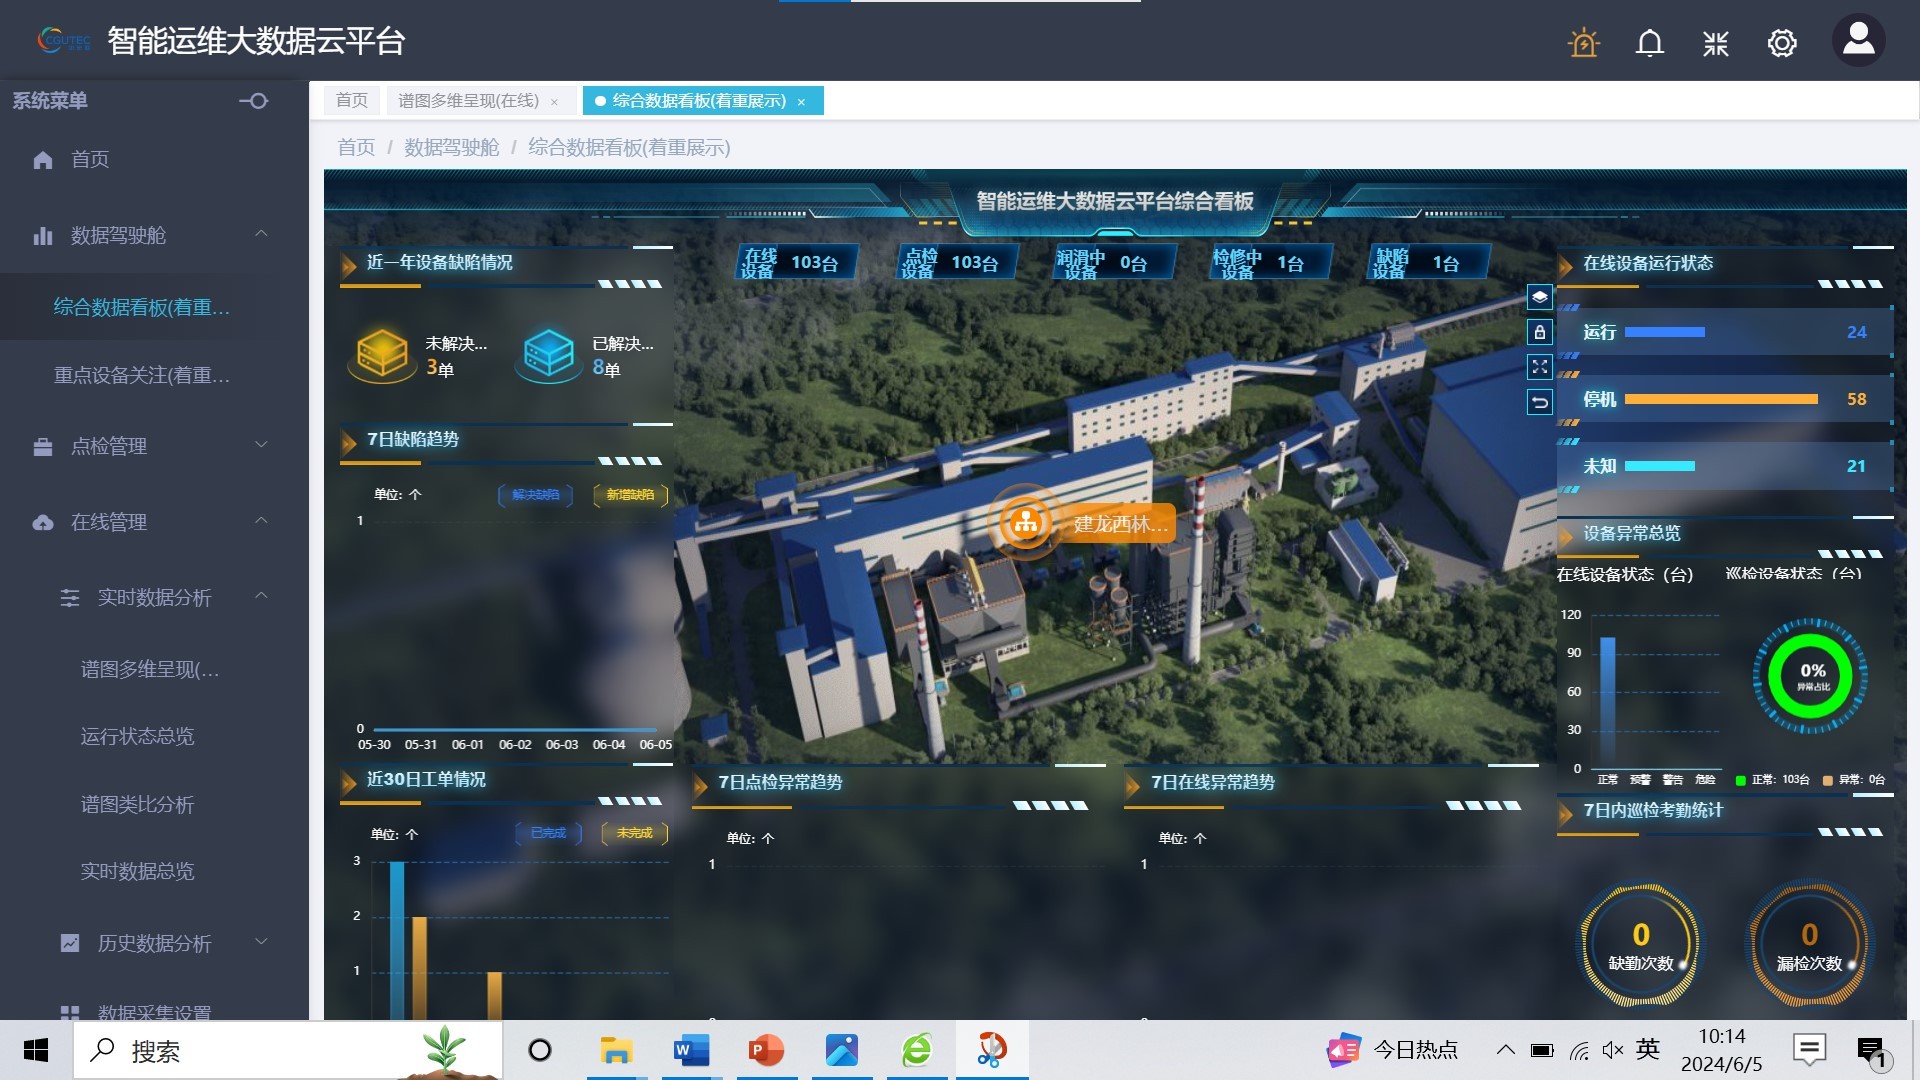
Based on the Industrial Internet Platform, collaborative production management realizes data communication with basic automation, MES, EMS and other systems. The platform organizes digitalized equipment & material business data, and accomplishes full-line production monitoring, coordination and statistics.
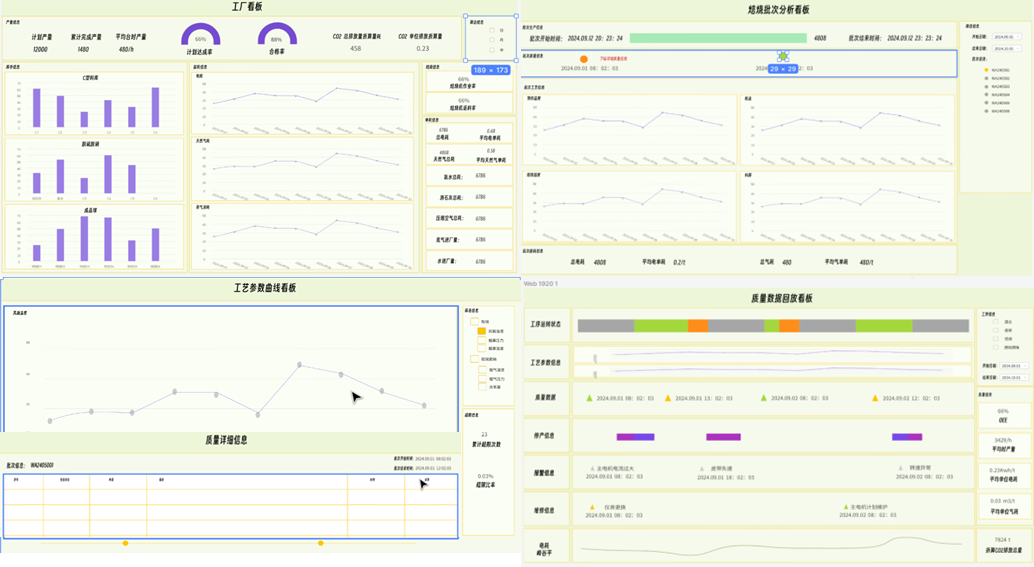
Process Specification Management
To build a standardized production control system and realize digital management of process specifications, administrators maintain process parameters and techno-economic indicators via this module. The system automatically records and analyzes the application of all specifications, correlates data with product quality and output, optimizes process rules and management systems, and improves technical and economic performance of production.
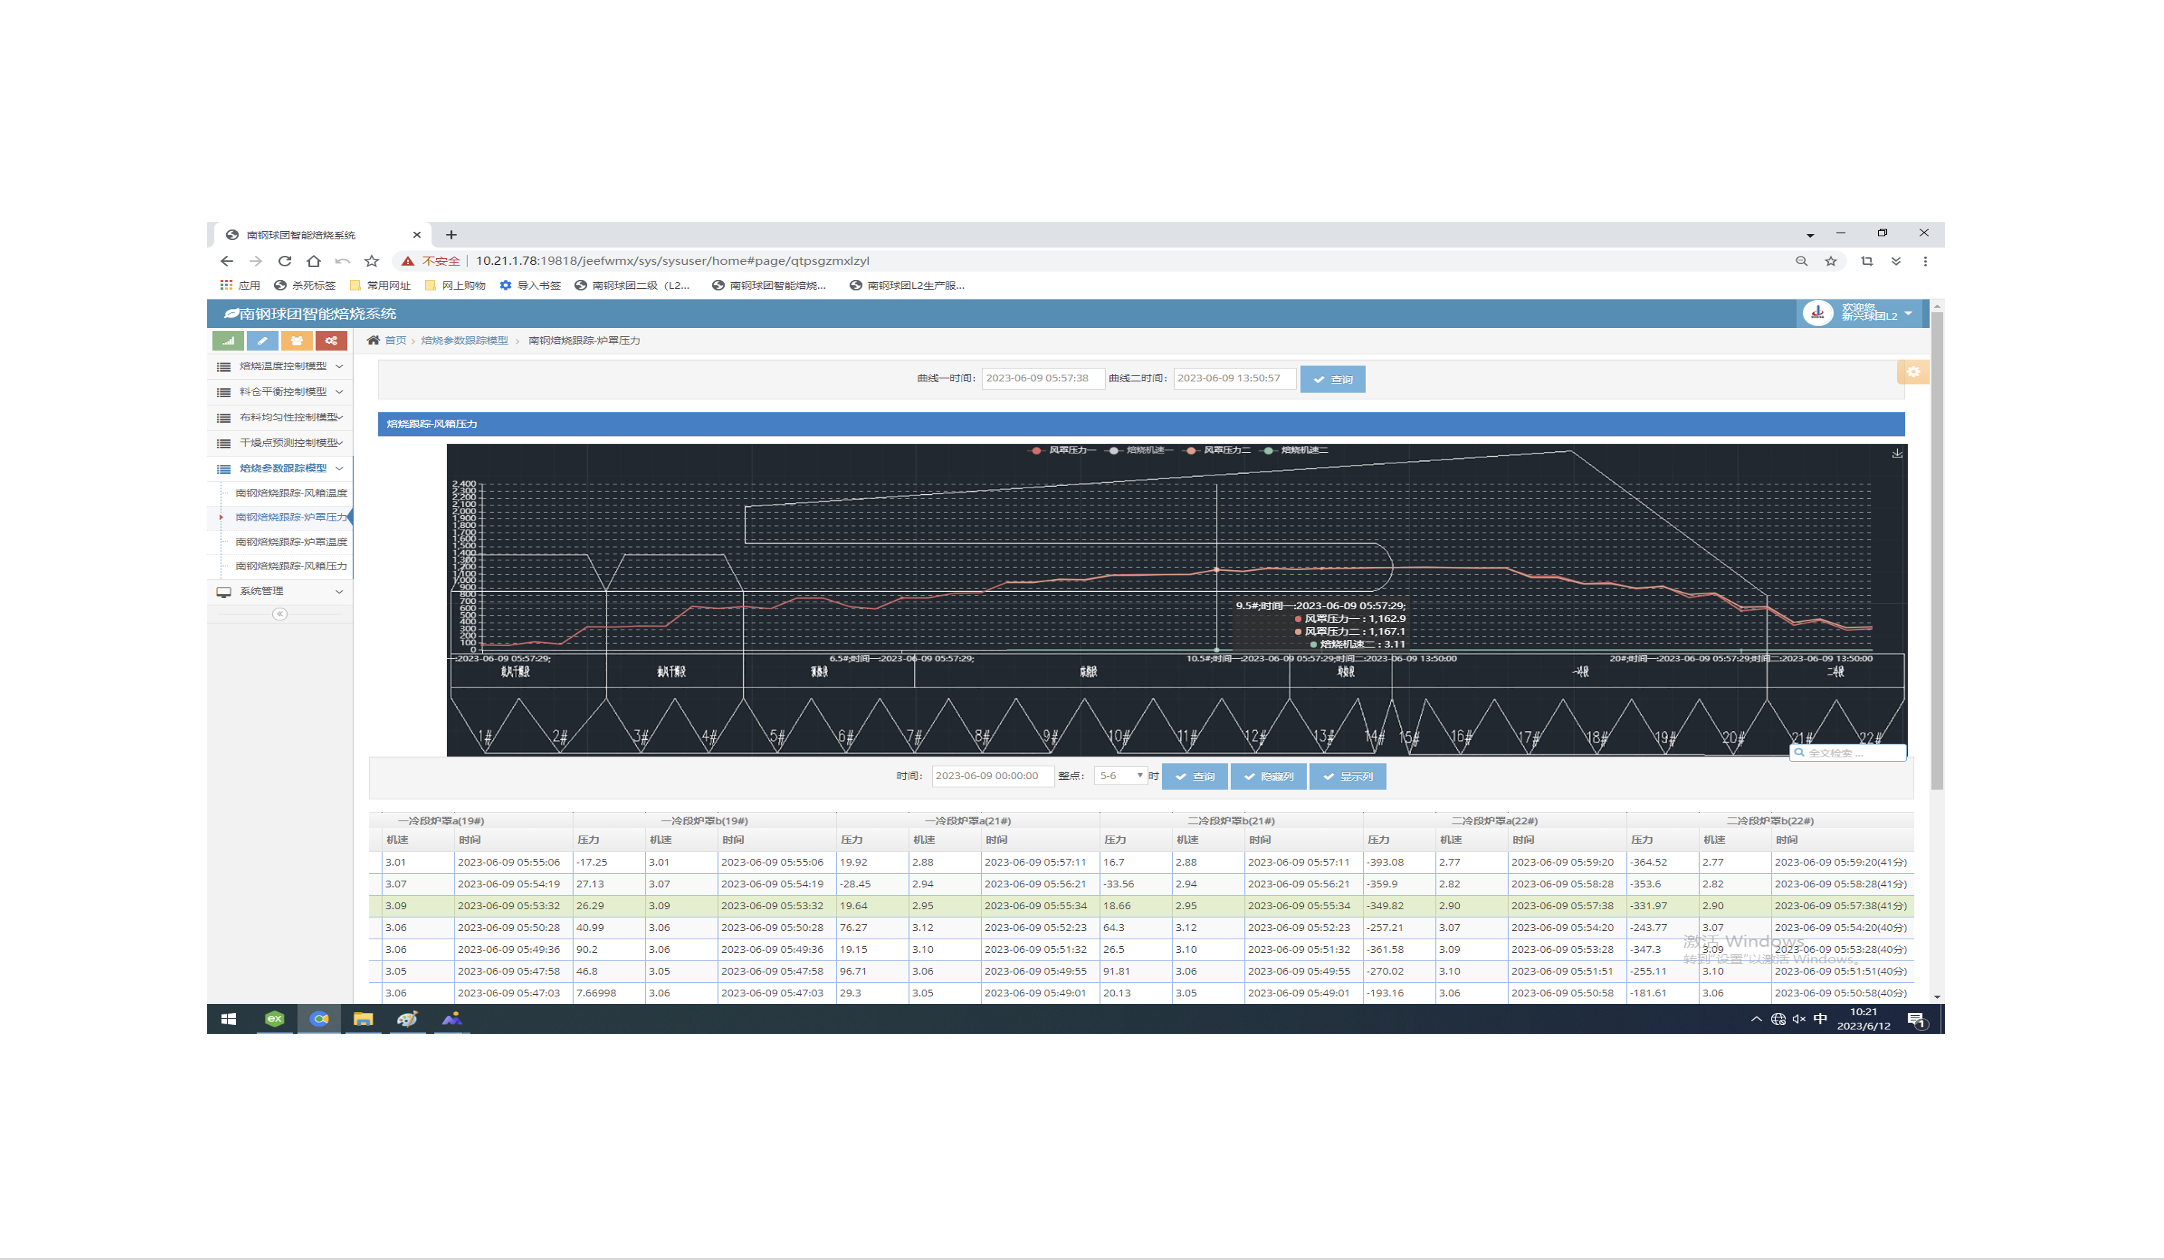
The system integrates raw material data, composition indicators and key quality parameters of each process. Supported by multiple statistical algorithms and quality management tools, it realizes quality data correlation & traceability, quality dashboard and fault analysis.
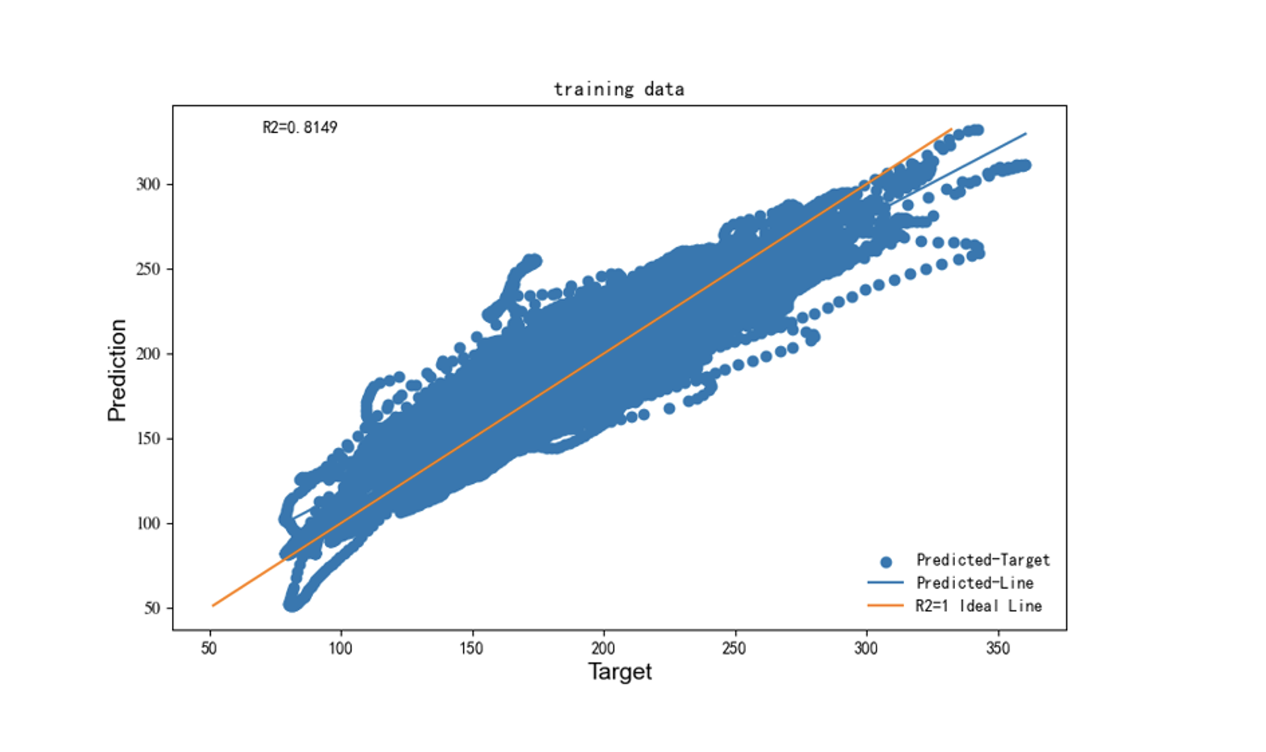
The AI quality prediction model is trained with on-site production data. To balance prediction accuracy and training speed, parameter correlation analysis is conducted before training. Several parameters most relevant to prediction targets are selected. Multiple algorithms are adopted for supervised learning, and the model with optimal prediction accuracy is selected for deployment. During operation, highly correlated parameters are input to calculate predicted target values together with confidence level.
The attached chart demonstrates model precision. In supervised learning, most data is used as training set and the rest as verification set. The model trained by training set predicts known verification data to verify accuracy. Horizontal axis represents actual target value, vertical axis represents predicted value. Blue dots and fitted blue accuracy curve are plotted; the orange-yellow line is the ideal accuracy line (k=1).
Copyright © China Grand Union Technology Co.,Ltd.(CGUTEC) All Rights Reserved. 京ICP备2021005877号-1